
The Direct Answer
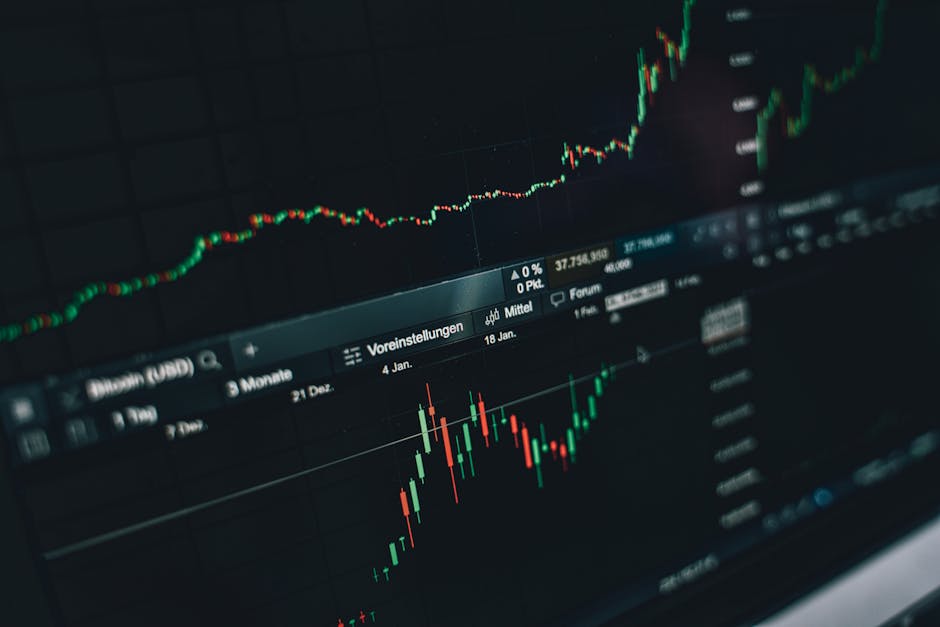
Why is the share market India experiencing fear today, with gold surging 3%? The primary reason is the uncertainty in the global economy, coupled with the rise in gold prices, which indicates a shift in investor sentiment towards safe-haven assets. As of today, July 03, 2026, the NIFTY 50 is at 24,324.9, and the SENSEX is at 78,033.14, with the India VIX at 11.88, indicating a decline in volatility. However, the Fear and Greed Index is at 21, signaling extreme fear, which is a concern for investors. I think this fear is partly driven by the 3% surge in gold prices today, which suggests that investors are seeking safe-haven assets.
The Deeper Context
The current market scenario is reminiscent of the 2008 financial crisis, where investors were seeking safe-haven assets due to the uncertainty in the global economy. The rise in gold prices is a clear indication of this trend, and it’s essential to understand the underlying factors driving this shift in investor sentiment. Honestly, I believe that the fear in the share market India is also driven by the ongoing geopolitical tensions, which are causing investors to become risk-averse. But here’s the thing — does it really work that way? Can we expect the share market India to rebound once the geopolitical tensions ease? In my view, it’s not that simple, and we need to consider various factors, including the FII/DII data, block deals, and bulk trades.
India View
The FII/DII data for India indicates that foreign institutional investors (FIIs) have been net sellers in the past few days, while domestic institutional investors (DIIs) have been net buyers. This trend is a concern, as it suggests that foreign investors are losing confidence in the Indian market. However, the DIIs have been supportive, which is a positive sign. The Bank Nifty, which is a benchmark for the banking sector, is at 57,905.85, with a decline of 0.22% today. This decline is a concern, as the banking sector is a key driver of the Indian economy. Indian traders can open a free account at Zerodha to stay updated on the market trends and make informed investment decisions.
US, UK and Brazil View
The S&P 500 and NASDAQ are currently experiencing a decline, with the S&P 500 at 7,483.24 and the NASDAQ at 25,832.67. The Dow Jones, however, is at 52,900.07, with a gain of 1.11% today. The US 10Y Yield is at 4.49, with a gain of 0.45% today. In the UK, the FTSE 100 is at 10,687.07, with a gain of 1.99% today. The DAX, which is a benchmark for the German market, is at 25,746.81, with a gain of 2.82% today. In Brazil, the IBOVESPA is at 172,787.62, with a gain of 0.44% today. The EUR/USD is at 1.15, with a gain of 0.88% today, which is a positive sign for the European economy.
Numbers and Levels
The NIFTY 50 is currently at 24,324.9, with a gain of 0.62% today. The SENSEX is at 78,033.14, with a gain of 0.69% today. The India VIX is at 11.88, with a decline of 3.34% today. The support levels for the NIFTY 50 are at 23,800 and 24,000, while the resistance levels are at 24,500 and 25,000. The S&P 500 has support levels at 7,400 and 7,500, while the resistance levels are at 7,600 and 7,700. For more information on the share market India trends, you can visit 24,000 NIFTY Ceiling Tests Investor Resolve Today and Analyzing Share Market India Trends For Beginners And Experts Alike Today.
What Happens Next
The market is expected to remain volatile in the coming days, with the uncertainty in the global economy and the ongoing geopolitical tensions. However, the decline in volatility, as indicated by the India VIX, is a positive sign. I’d argue that the share market India is due for a rebound, but it’s essential to consider the various factors driving the market trends. The FII/DII data, block deals, and bulk trades will be crucial in determining the market direction. For instance, if we see a significant increase in FII inflows, it could lead to a surge in the market. On the other hand, if the DIIs continue to be net buyers, it could provide a support to the market.
📺 Watch on YouTube: 🎯 ZENO Ki Baat: Trade With Patience — 02 Jul 2026 #Shorts
More Questions
FAQ:
- What is driving the fear in the share market India today? The fear in the share market India is driven by the uncertainty in the global economy, the rise in gold prices, and the ongoing geopolitical tensions.
- How can I stay updated on the market trends? You can stay updated on the market trends by visiting Discover Share Market Today Trends That Reveal Investor Sentiment Shifts and opening a free trading account at a reputable broker like Zerodha in India or Webull in the USA.
- What are the support and resistance levels for the NIFTY 50? The support levels for the NIFTY 50 are at 23,800 and 24,000, while the resistance levels are at 24,500 and 25,000. You can also visit 24,181 NIFTY Level Triggers Extreme Fear Among Global Investors Today for more information on the NIFTY 50 levels.
| *July 03, 2026 | Educational content only. Not SEBI registered investment advice.* |
📈 Get Tomorrow's Trade Setups — Free
🎯 Join our free Telegram channel for daily Nifty signals & market alerts.
💎 Want exact entry / stop-loss / target? ₹699 Advance / ₹1,499 Premium — DM us on Telegram.
🪙 Open a free demat to trade these ideas: Zerodha · Dhan · CoinDCX (crypto)
💬 Found this useful? Share it with a trader friend. Educational only — not SEBI registered.
🤖 Produced with AI tools · 📊 Based on real market data and sources · Educational only, not investment advice.
